
March 2022 Housing Market Update
Initial Jobless Claims - Week of 2/26/22

Initial Jobless Claims, which measures individuals filing for unemployment benefits for the first time, decreased 18,000 to 215,000. Continuing claims, which are those that continue to receive benefits after their initial claim, increased 2,000 to 1.48M, which is just off the lowest level since 1970. Claims are at very strong pre-covid levels, showing that the labor market remains tight.
Courtesy MBS Highway | Source: dol.gov
ADP Employment Report
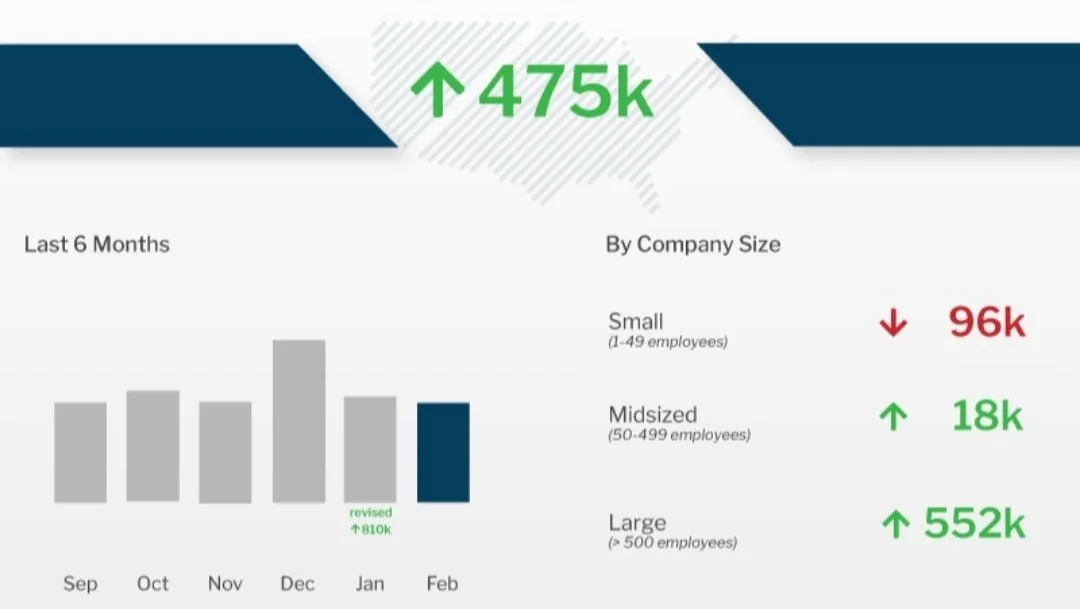
ADP Employment Report shows 475k job creations in February, which was stronger than expectations of 400k. The January report was revised higher from 301k job losses to 509k job gains, a total revision of 810k. Small businesses lost 96k jobs, while large businesses saw a gain of 552k. This shows that large businesses are better suited to compete with higher wages and benefits, while small businesses are losing ground as they struggle to keep pace and in turn are less successful in attracting talent from the limited pool of qualified workers.
Courtesy MBS Highway | Source: adpemploymentreport.com
New Home Sales - January 2022

New Home Sales were down 4.5% in January at an 801,000 unit annualized pace, which was much stronger than expectations of a 8.6% decline. There was a positive revision to the December reading, and when factoring that in, sales were only down around 1.0%. Year over year sales they are down 19%. The median home price came in at $423,300, which is an increase of 12% from the previous report. The median home price is up 13.4% year over year and points to an increase in higher priced homes sold.
Courtesy MBS Highway | Source: census.gov
Pending Home Sales

Pending Home Sales, which measures signed contracts on existing homes, fell 5.7% in January, which was weaker than expected. Last month’s reading was revised higher, and when factoring that in, it’s down closer to 4%. Sales are now down 9.5% year over year. There is no doubt that higher interest rates could be impacting demand, but the real story here is inventory. There were only 860,000 homes for sale last month - If there were more homes for sale, there would be more sales.
Courtesy MBS Highway | Source: Region Data M/M
Contact Us
847-634-2252
info@longgrovemortgage.com
NMLS #210846